At HasData, reliability is something we engineer, monitor, and validate every single day (and we mean it). In this post, we’ll show you the systems behind our 99.9% uptime: synthetic testing, monitoring dashboards, proxy health checks, and infrastructure choices.
Synthetic Tests: Validating APIs Every Day
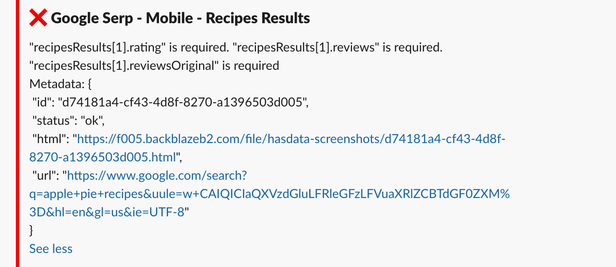
We continuously run synthetic tests across all our APIs. Several times per day, each API is exercised with at least 10 parameter variations.
Take our Google SERP API for example. When we query q=coffee, a “healthy” response should include at least 7 organic results, a knowledge graph, a local pack, related questions, pagination, and more.
We validate each block individually. For organic results, for instance, we check that every entry includes a link, title, and snippet. If anything falls short, we know immediately.
All results flow straight to Slack, so the team is alerted before customers ever feel the impact.


Monitoring Dashboards: Success Rates and Latency
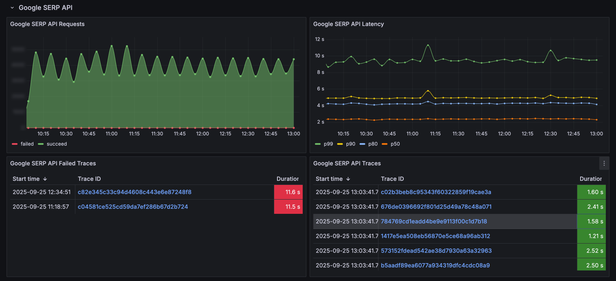
Synthetic tests catch regressions, but real-time visibility into production traffic is just as important. Every API has two key dashboards:
- Success/Failed Requests Chart: tracks the ratio of successful responses to failures.
- Latency Chart: measures p50, p80, p90, and p99 latencies.
If failures or p99 latency increases, alerts go to our monitoring channel. From there, engineers can drill into the exact request ID, with full logs and cross-service traces.

Proxy Health: Monitoring the Hidden Layer
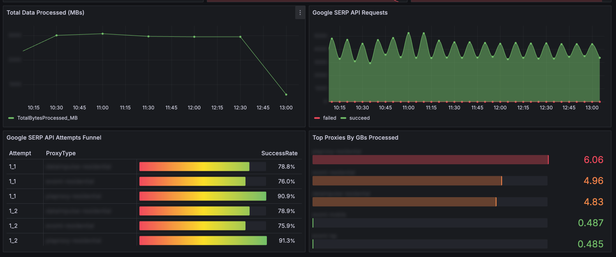
Much of our success rate comes down to the proxy networks powering our APIs. We monitor them just as closely as the APIs themselves:
- Success rate per API per retry
- Traffic volume per proxy
- Median response size of scraped pages
If a proxy underperforms, we isolate and replace it before it affects users.

Infrastructure and Observability
Our APIs run on a self-hosted Kubernetes cluster. Managing our own infrastructure gives us the control we need for performance and scaling.
- Dedicated servers run our database instances
- Dedicated servers power the monitoring stack
- Grafana + Prometheus track metrics across the system
- ClickHouse stores traces and logs for high-volume analysis
This setup scales to millions of requests while keeping costs predictable and visibility high.
.2r0BFlvR_Pg0o5.png)
How It Works in Practice: An Incident Flow
Here’s how these systems connect when an issue occurs:
- A synthetic test fails and alerts the team in Slack
- Latency charts confirm a spike in p99 latency
- Proxy monitoring shows a drop in success rate for one of the proxies
- Engineers reroute traffic, replace the failing proxy, and confirm resolution
The loop from detection to fix is fast and transparent because every layer is monitored and traceable.
Why This Matters to Our Customers
Everyone claims “99.9% uptime.” For us, it’s a 24/7 engineering process.
- Failures are caught early, often before they reach production scale
- Latency is continuously tracked across percentiles, not just averages
- Infrastructure is built for scale, instead of just a minimum viable setup.
With HasData, you don’t have to wonder if your requests will succeed — our monitoring, testing, and infrastructure ensure they do.


