AI Overviews appeared in roughly 30% of the Google searches we measured for the 2025 study. In the 2026 re-run with the same intent buckets and detection method, they appear in 67% of queries on our panel, and in every intent group where users want a fix or an explanation the rate is 88% or higher. This page carries both measurements, the per-intent statistics, and four things the 2025 study did not track: which domains the AI answers cite, whether those domains rank organically on the same SERP, whether a site that owns its niche gets cited on its own queries, and how much of an answer’s source list survives a week.
What Changed in a Year
Every intent group triggers AI Overviews more than it did a year ago, and the event, DIY, and comparison groups jumped by 70 points or more. The 2025 study analyzed 150,000+ SERPs. The 2026 re-run uses the same intent buckets and the same detection method on a fixed panel of 100 queries per intent, 1,100 in the first pass with travel (the twelfth row) measured in a second pass a week later, so the columns compare like with like (the sample sizes differ, and the methodology section covers what that means for precision).
| Intent | AI Overview rate, 2025 study | AI Overview rate, 2026 panel | Change |
|---|---|---|---|
| Symptom checkers | 75% | 100% | +25 pts |
| Tech troubleshooting | 56% | 99% | +43 pts |
| How-to tutorials | 44% | 93% | +49 pts |
| DIY home projects | 17% | 88% | +71 pts |
| Informational | 48% | 98% | +50 pts |
| Navigational | near zero | 27% | +27 pts |
| Find nearby (local) | 0.14% | 8% | +7.9 pts |
| Event searches | 7% | 82% | +75 pts |
| Purchase intent | 5.5% | 42% | +36.5 pts |
| Product comparisons | 21% | 91% | +70 pts |
| Recipes | 2% | 4% | +2 pts |
| Travel planning | 21% | 99% | +78 pts |
The biggest climbers are the groups Google was visibly holding AI back from in 2025. Travel planning gained 78 points, event searches 75, DIY projects 71, product comparisons 70. The 2025 conclusion that Google keeps AI out of transactional, local, and recipe results survives in exactly two places, local searches (8%) and recipes (4%), which still route to purpose-built features. Purchase queries, the group where the 2025 study found Google pushing products instead of AI answers, now carry one on 42% of SERPs.

The size of those jumps is why the comparison needed the same protocol on both ends, and the protocol itself is short enough to publish in full.
How We Measured It
Trigger rate is the share of queries in a group whose SERP carries an AI Overview. Citation share is the share of AI answers that cite a given domain. Both come from the same per-query records the protocol below produces.
Sample, Intents, and What We Recorded
The 2025 study generated 300 seed keywords per intent with Gemini, expanded them through Google Keyword Planner, and sampled 150,000+ queries. The 2026 panel keeps the intent buckets and shrinks the sample to a fixed list, published in full with every per-query row, built by template rather than by expansion.
| Setting | This panel |
|---|---|
| Queries per intent bucket | 100 |
| How they are built | 20 topics per bucket crossed with 5 natural phrasings |
| Intent buckets | 11 in the first pass, 12 once travel joined |
| Device and location | desktop, US results, Austin, Texas |
| Request pacing | one at a time |
| 95% confidence interval on a rate | about ±10 points at worst |
That interval is wide next to the original sample and narrow next to the year-over-year changes it measures. A fixed list is what makes the panel republishable, and this is what it costs in precision.
Each query ran once through the Google SERP API. Every response contributed a presence flag for each of the 12 SERP features listed in the record table below, and every AI Overview contributed its cited source domains, deduplicated per answer.
Fetching those sources takes one call or two. The SERP response sometimes carries them inline and sometimes only a page token, in which case a follow-up call to the AI Overview API fetches the answer and its source list inside the token’s roughly 4-minute lifetime. On this panel, 268 of the 732 answers needed that second call, and 9 returned no parseable sources at all, which is why the citation shares below divide by 723.
Each collection below feeds a different part of the analysis.
| Collection | Queries | What it recorded | What it feeds |
|---|---|---|---|
| First pass | 1,100 | SERP feature flags, AI answer sources | trigger rates, the feature matrix, citation shares |
| Second pass, a week later | 1,200 | the same, plus organic results down to position 50 | the ranking and stability sections |
| Niche collection | 552 | the same settings, on top pages of 113 niche domains | the niche-site section |
The second pass repeats the same 1,100 queries under the same protocol and adds the travel bucket in the same 20-topics-by-5-phrasings shape. Its extra work is five pages of organic results per SERP through the start parameter, fetched only for responses whose AI answer carried parsed sources, since their one job is locating cited domains. It carried an AI Overview on 750 of the shared 1,100 queries against the first pass’s 732, and 849 of its 1,200 SERPs held an answer, 832 of them with parsed sources.
One collection artifact affects that pass alone. For some organic slots and some answer sources the recorded link was a bare google.com URL where a re-fetch of the same query shows a real domain in that slot, so those entries carry no attributable domain. Every ranking comparison below drops bare google.com from both the organic lists and the source lists, keeping real subdomains such as support.google.com, which leaves 805 sourced answers in play. Each coupling number is therefore a floor, because an entry that was in truth a match counts as a miss.
The 2026 queries are a new fixed list rather than a re-sample of the 2025 pool, so the year-over-year deltas compare intent buckets and not identical queries. The navigational rate also has a characterized rather than measured 2025 baseline, because the original study called it near zero without publishing a number. Both limits bound what the comparison tables below can claim.
What a Per-Query Record Carries
An AI Overview dataset is a per-query record of whether an AI answer appeared and which sources it cited. This panel produced 1,100 such rows in the first pass and 1,200 in the second, one per query, with these columns.
| Column | Values | Meaning |
|---|---|---|
intent | one of 11 bucket names (12 in the second pass) | The intent group the query belongs to |
query | text | The query as sent |
ai_overview | 0 or 1 | Whether the SERP carried an AI Overview |
sources | semicolon-separated domains | Distinct domains the AI answer cited, empty when none parsed |
organic | domain and position pairs | Organic results of the same SERP down to position 50, second pass only |
| 11 more feature flags | 0 or 1 each | featured_snippet, paa, knowledge_panel, local_results, shopping_block, product_block, recipe_results, events_results, videos, discussions, perspectives, which with ai_overview make the 12 recorded features |
Every table below recomputes from rows in this shape, and the two divisions the next section describes run against exactly these columns.
How to Compute Trigger Rate and Citation Share Yourself
Trigger rate needs a query list and a SERP source that preserves the AI Overview block. Group queries by intent, fetch each SERP once, count the share of responses whose aiOverview block is present. Citation share needs the answer’s source list. Extract the cited URLs, reduce them to domains, and divide the number of answers citing a domain by the number of answers with parsed sources. Every number in this article reduces to those two divisions over the panel’s per-query records, so re-running the protocol on your own query list is a loop and two counters.
AI Overview and SERP Feature Rates by Intent
An AI Overview appears on 732 of the panel’s 1,100 SERPs, and the matrix below shows which features share those pages. Each cell is the share of the bucket’s 100 SERPs carrying that feature. Features co-occur on one page, so rows sum to well over 100%. The travel row comes from the second pass described in the methodology:
| Intent | AI Overview | PAA | Knowledge panel | Local results | Product blocks | Videos |
|---|---|---|---|---|---|---|
| Symptom checkers | 100% | 100% | 0% | 0% | 0% | 27% |
| Tech troubleshooting | 99% | 100% | 0% | 0% | 0% | 97% |
| How-to tutorials | 93% | 98% | 0% | 0% | 0% | 79% |
| DIY home projects | 88% | 100% | 1% | 9% | 9% | 87% |
| Informational | 98% | 95% | 0% | 0% | 0% | 60% |
| Navigational | 27% | 47% | 2% | 2% | 0% | 4% |
| Find nearby (local) | 8% | 84% | 0% | 99% | 0% | 1% |
| Event searches | 82% | 95% | 2% | 40% | 0% | 1% |
| Purchase intent | 42% | 93% | 1% | 36% | 89% | 19% |
| Product comparisons | 91% | 100% | 0% | 0% | 0% | 68% |
| Recipes | 4% | 100% | 1% | 2% | 0% | 11% |
| Travel planning | 99% | 100% | 1% | 0% | 0% | 3% |
Featured snippets scored zero across all 1,100 queries and get no column in the matrix. Even classic snippet queries we probed separately (“how long to boil eggs”) now return an AI Overview instead, so the feature the 2025 study measured at 22% on informational queries has left these SERPs entirely. Knowledge panels collapsed the same way, from 17% on informational queries in 2025 to at most 2% in any 2026 bucket, and travel is the starkest case, 41% knowledge panels in the 2025 study against 1% now. People Also Ask, at 84-100% everywhere except navigational queries, remains the one classic feature AI answers have not displaced. On the specialized rows the old structure holds. Recipe cards appear on 98% of recipe queries, the local pack on 99% of find-nearby queries, and immersive product blocks on 89% of purchase queries.
The same 66 cells shaded by presence show where the displacement happened and where it did not.
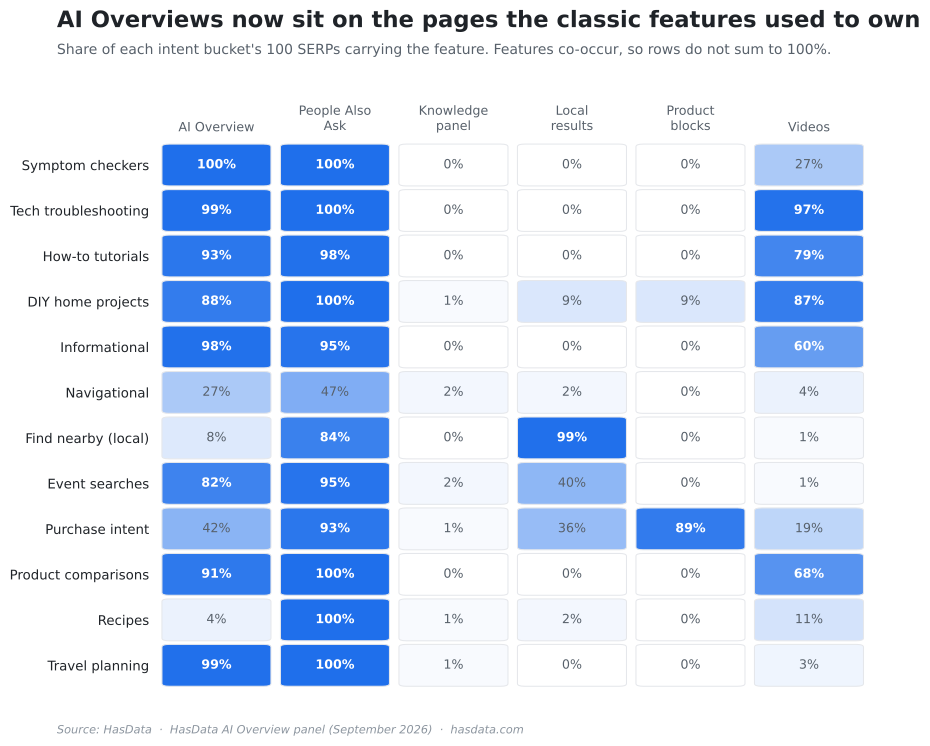
Two features without a column in the matrix moved in opposite directions since 2025. Discussion and forum blocks on DIY queries fell from 57% to 31% while the bucket’s AI rate quintupled, the module AI answers most directly displaced. Perspectives went the other way, from 28% to 46% on product comparisons, so the SERPs where trust in generated text is lowest now carry the AI summary and human opinions side by side.
Where AI Overviews Stay Out
Two intent groups still keep AI answers on the sidelines, and both are the ones with a dedicated SERP feature doing the job. Find-nearby queries trigger an AI Overview on 8% of SERPs while the local pack covers 99% of them, because a map with pins answers “pizza near me” better than a paragraph can. Recipe queries are at 4% AI against 98% recipe cards, and the cards carry exactly what the searcher wants to scan, photos, ratings, and cook times.
Navigational queries are the interesting middle at 27%. When someone types a brand name plus “login” or “app,” Google mostly still routes them to the site, but support-flavored navigational queries (“account settings,” “help center”) increasingly get an AI answer summarizing the steps, citing app stores and the brand’s own help pages. The purchase group left this section altogether. With AI answers on 42% of purchase SERPs next to product blocks on 89%, Google now runs both layers on the same commercial page.
Who Gets Cited
YouTube is cited by 72% of the AI answers on this panel, and no publisher comes close. Across the 723 answers with parsed sources, 1,122 unique domains appear, and 654 of them (58%) are cited exactly once, so beneath a short head of platforms the citation pool is a long tail of individual pages:
| Domain | Answers citing it | Share of answers |
|---|---|---|
| youtube.com | 522 | 72% |
| reddit.com | 178 | 25% |
| facebook.com | 77 | 11% |
| my.clevelandclinic.org | 64 | 9% |
| homedepot.com | 53 | 7% |
| learn.microsoft.com | 52 | 7% |
| mayoclinic.org | 48 | 7% |
| quora.com | 45 | 6% |
| lowes.com | 39 | 5% |
| support.microsoft.com | 33 | 5% |
| eventbrite.com | 33 | 5% |
| webmd.com | 29 | 4% |
The head of the table changes shape per intent, and it tracks authority within the topic rather than general site size. The most-cited domain besides YouTube, per intent:
| Intent | Most-cited domain besides YouTube | Answers citing it |
|---|---|---|
| Symptom checkers | my.clevelandclinic.org | 57 of 100 |
| Tech troubleshooting | learn.microsoft.com | 52 of 99 |
| How-to tutorials | reddit.com | 33 of 92 |
| DIY home projects | homedepot.com | 44 of 87 |
| Informational | en.wikipedia.org | 19 of 98 |
| Navigational | apps.apple.com | 11 of 27 |
| Event searches | eventbrite.com | 33 of 79 |
| Purchase intent | rtings.com | 7 of 39 |
| Product comparisons | reddit.com | 61 of 90 |
Health answers pull medical authorities (Mayo Clinic and WebMD follow Cleveland Clinic), tech answers pull Microsoft’s own documentation, DIY answers pull the retailers whose products the walkthroughs use, and comparison answers lean on Reddit and Quora, the places where people argue about products. The event row carries the panel’s Austin location (its city guides are austintexas.org and do512.com), so that row localizes to wherever you run the queries from.
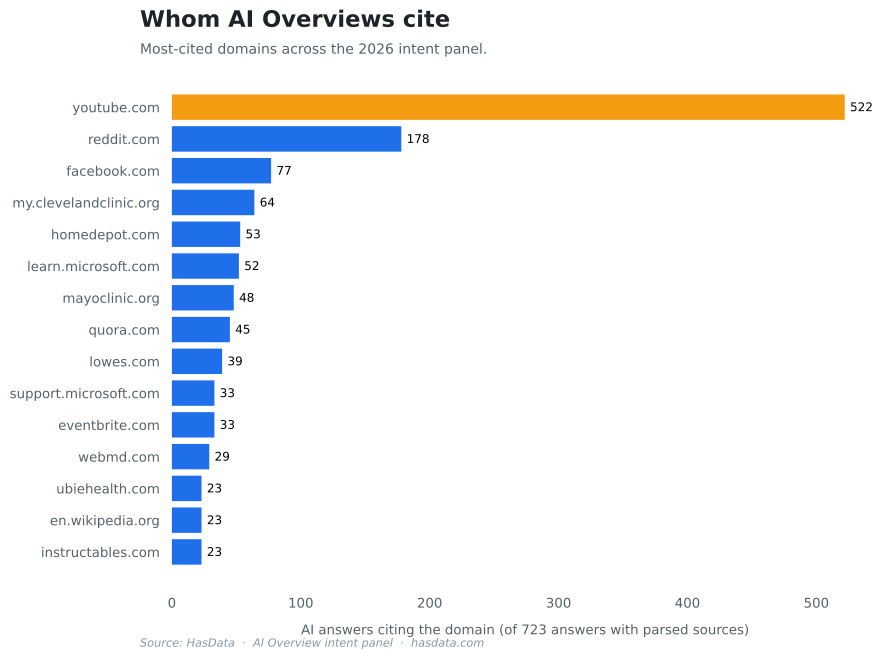
Citation share is a per-answer probability, so how much of it exists to compete for depends on how many sources an answer names.
How Many Sources One Answer Pulls
An AI answer on this panel cites 5 distinct domains on average, and the overall median is also 5. The count follows intent, though. Symptom answers cite about 7 domains, informational answers 6, and purchase and navigational answers about 3, so health answers hand out roughly twice the citation slots of commercial ones. An AI-bearing SERP hands out three to seven citation slots depending on the intent, one or two usually go to YouTube or Reddit, and the rest are contested by every page that covers the topic.
Featured Snippets and AI Citations
The 2025 study reported that a page holding the featured snippet had a 60%+ chance of also being cited in the AI Overview. That relationship can no longer be measured, because its precondition is the zero column in the matrix above. The snippet’s slot, the extracted direct answer above the organic results, is now occupied by the AI answer itself, so the optimization path that ran through snippet ownership in 2025 now runs through being one of the cited sources.
Do You Have to Rank to Get Cited
At the answer level, yes. 91% of the 805 AI answers with attributable sources cite at least one domain from the same SERP’s organic top 10, and in nine of the twelve intent buckets that share is 95% or higher. The three fix-it buckets read lower (DIY 70%, tech troubleshooting 72%, how-to 82%), but those are also where the parser artifact from the methodology concentrated, so their floors are the loosest. Citation by citation the coupling is weaker. Of the 3,776 attributable citations in the second pass, 58% point at a domain ranking in that SERP’s top 10, 20% at positions 11 to 20, 10% at 21 to 50, and 13% at a domain that appears nowhere in the first five pages.
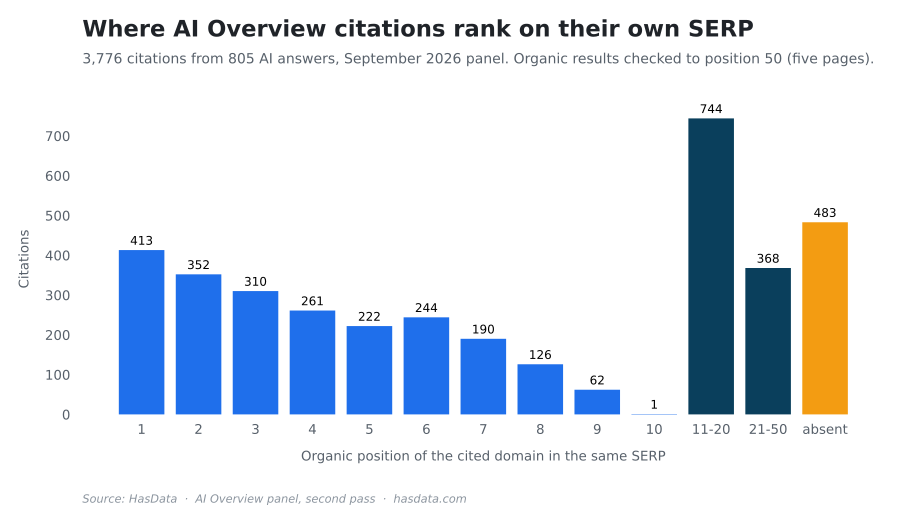
The histogram falls with position almost monotonically, and position 1 alone accounts for 413 citations, more than positions 7 through 10 combined. The bars thin at the bottom of page one partly for a mechanical reason. When an AI Overview and other features are present, the page-one organic list often stops at eight or nine results, so those slots exist on fewer SERPs. The split by domain shows who needs the ranking and who does not.
| Domain | Citations | In top 10 | Positions 11-50 | Not in top 50 |
|---|---|---|---|---|
| youtube.com | 536 | 229 | 296 | 11 |
| reddit.com | 199 | 178 | 7 | 14 |
| facebook.com | 105 | 61 | 39 | 5 |
| my.clevelandclinic.org | 60 | 54 | 5 | 1 |
| quora.com | 43 | 30 | 7 | 6 |
| instagram.com | 40 | 13 | 17 | 10 |
| mayoclinic.org | 37 | 35 | 1 | 1 |
| homedepot.com | 37 | 21 | 7 | 9 |
For a publisher, citation and ranking are the same event. Mayo Clinic ranks in the top 10 on 95% of the SERPs where an AI answer cites it, Cleveland Clinic on 90%, and Reddit behaves the same way at 89%. YouTube is the exception. 43% of its citations come with a top-10 ranking and another 41% from positions 11 to 20, so the answer routinely reads YouTube results from page two, a page few users open. The 13% of citations with no top-50 ranking form a long tail with no single owner (Reddit leads it with 14, followed by YouTube and Instagram), and for a site that is not a platform, page one remains the entry ticket to AI citations.
The coupling runs one way, though. Ranking well does not guarantee a citation. On 40% of the answers, the domain holding position 1 is not cited at all, and on 18% the AI answer skips the entire visible top 3. Position 1 is cited by 60% of answers, the odds fall almost monotonically to 33% at position 9, and past the first page they fade slowly, from 30% at position 11 to the high teens by the fifth page. A deep ranking still carries a real chance while the exact slot stops mattering.
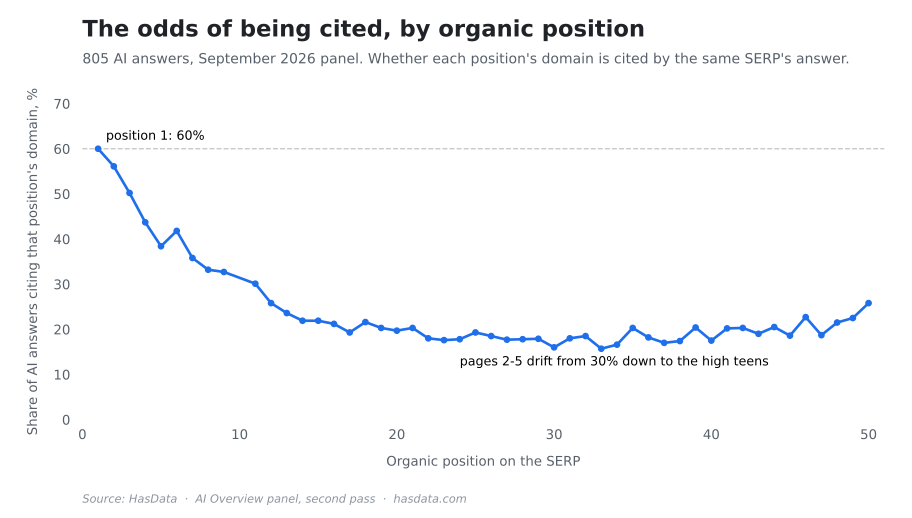
The odds also depend on what the query wants. The number-one domain gets cited on 84% of navigational answers and 76% of product comparisons, but only on 45% of purchase answers and 44% of event ones, where the AI reads maps, review platforms, and store pages more than the organic winner. Holding the top spot on a SERP where the answer ignores you is the situation to monitor for, and it is common enough to deserve its own row in a rank report.
Do Niche Sites Get Cited on Their Own Turf
A niche site that ranks in the top 10 for a query on its own topic is cited by the AI answer in 77% of cases, well above the 60% that position 1 itself earns on the main panel (and every slot below position 1 earns less). Ownership of a topic transfers into AI answers more reliably than raw position does.
That number comes from isolating the sites that actually own their group’s rankings, since the odds above mix platforms and publishers. From each intent group we took the ten domains most often holding organic position 1 on the panel, with platforms excluded (Reddit, YouTube, the app stores, the marketplaces), which left 113 niche domains: clinics, cooking blogs, tool retailers, city event calendars, travel writers. For each we pulled its own top pages with a site: query, used those pages’ titles as 552 queries, and fetched the SERPs.
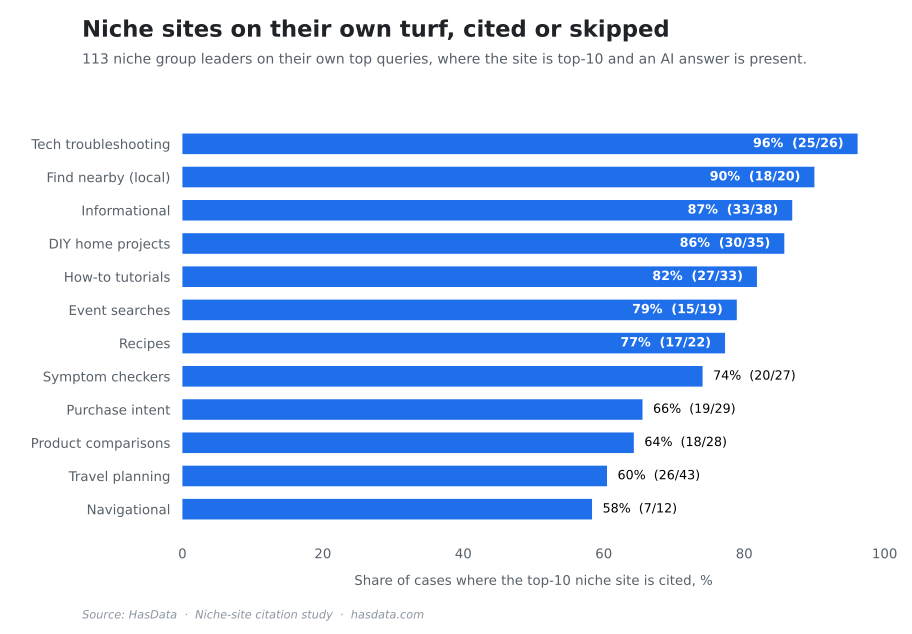
Per intent, the same winners and laggards show up at a higher level. Tech troubleshooting (96%), find-nearby (90%), and informational sites (87%) get cited almost whenever they rank. The gap opens on travel (60%), navigational (58%), and product comparisons (64%), where the answer prefers platforms and aggregators even when a niche site holds the visible top. A travel blogger ranking in the top 10 for their own itinerary query still gets skipped by two answers in five, which is the sharpest version of the top-but-not-cited problem this page measures. The per-bucket samples are small here, 12 to 43 qualifying SERPs per group, so read the split as a pattern rather than as point estimates.
What a Week Does to an AI Overview
An AI Overview that exists this week almost certainly exists next week, but it will not be reading the same pages. On the presence side, 1,042 of the 1,100 shared queries kept their status between the two passes, 712 answered both times and 330 answered neither time, while 38 gained an AI Overview and 20 lost one, a 5% flip rate. The flips concentrate where the trigger rate is mid-range (purchase moved on 17 queries, navigational on 14), the saturated buckets barely moved, and symptom checkers stayed at 100% in both passes. Per-intent trigger rates shifted by five points at most.
The source lists rotated much faster than the block itself. Among the 666 queries whose answer carried attributable sources in both passes, the median answer kept 60% of its cited domains and replaced the other 40% within the week, and 29% of the answers replaced more than half of their list. 2% kept no domain in common at all. The chart states the same churn as the Jaccard overlap of the two sets, where the median is 0.44.
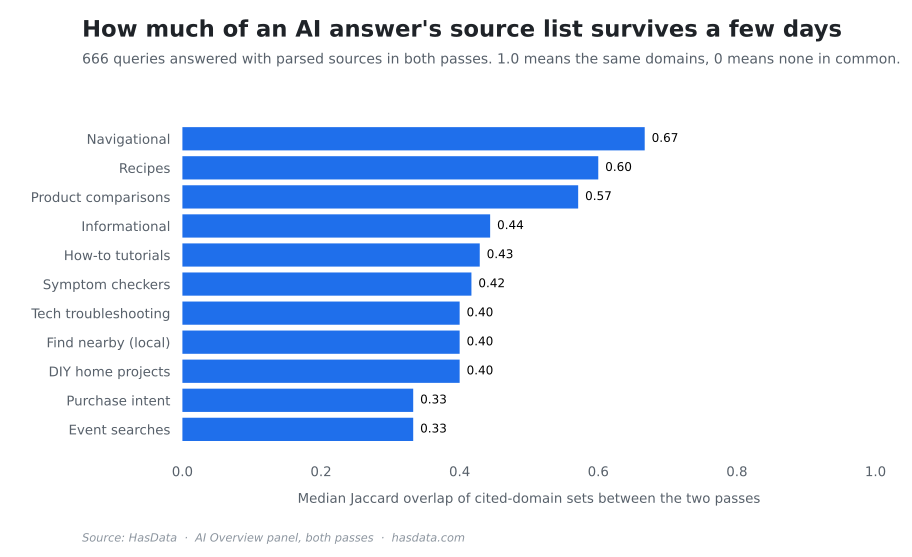
Event searches and purchase queries churn hardest at 0.33 and navigational queries least at 0.67, which matches the citation tables. A brand query has a short fixed set of authoritative pages, while an events query reads a feed that changes with the calendar. A citation earned today can drop out of the answer within a week, so keeping it is a monitoring job rather than a one-time optimization.
So Is SEO Dead
On this data SEO still works, but it pays out in citations rather than clicks. The classic loop (rank, get the click) is shrinking. AI Overviews appear on 67% of the panel’s queries, they absorbed the featured snippet outright, and the answer often satisfies the searcher before they reach a blue link. The threshold moved too. A year ago an AI answer appeared where synthesis clearly beat a link list, about 30% of SERPs. Now it appears everywhere synthesis is merely possible, and the holdouts are only the intents with a purpose-built feature (local packs, recipe cards) or an obvious destination (navigational queries).
What replaces the old loop is measurable on the same records. Page one still gates the answer, since 91% of AI answers cite at least one domain from their own SERP’s top 10 and only 13% of citations come from beyond the top 50, so ranking keeps mattering as the entry condition. What a ranking buys changed. It qualifies a page for citation, and the citation is the result to measure. Position 1 goes uncited on 40% of answers, a niche site that owns its topic gets cited on 77% of its top-10 SERPs, and the median answer replaces 40% of its source list within a week. The new job is to earn the ranking and then treat the citation as the thing to win and to watch, because citations churn faster than positions ever did.
Where to move depends on the intent group. Tech, informational, local, and how-to sites convert rankings into citations at 82-96% and should double down on exactly what they rank for. Travel, comparison, and purchase content gets skipped even from the top, so for those intents the page is one channel among several rather than the destination, and the citation report matters more than the rank report. Trigger rate answered 2025’s question of where AI shows up, and the answer is now almost everywhere. The 2026 question is who gets cited. Re-running the protocol on your own query list answers it for your site instead of for the industry, and repeating it on a schedule turns the same two divisions into AI Overview SERP tracking, the AI-era counterpart of classic rank tracking.