All modern browsers have built-in functions Developer Tools or simply DevTools. DevTools is a set of developer utilities that are built into the browser and make one’s work more comfortable. Some users call it “the developer console”.
This article will describe 5 tips & tricks for Chrome DevTools that we use for scraping and developing frontend or backend applications.
How to open DevTools?
There are several ways to open the Developer Console, and they are all equally effective.
Method #1: Go to Inspect from Web Page
Right-click on any area of the web page and in the context menu click Inspect.
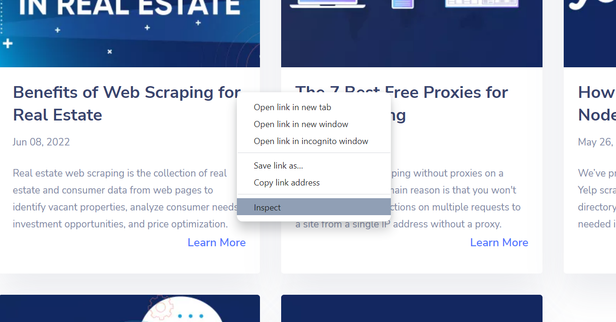
Method #2. Using hotkeys
There’s also a faster way to open the Developer Console by using hotkeys. But they can differ for various operating systems and browsers.
Hotkeys for macOS:
- To open the Elements tab:
command ⌘+option+C - To open the Console tab:
command ⌘+option+J
Hotkeys for Windows/Linux/ChromeOS:
- To open the Elements tab:
Ctrl+Shift+C - To open the Console tab:
Ctrl+Shift+J
Also, for most browsers under Windows and Linux operating systems, one can go to the developer console by pressing the F12 key.
DevTools Review
There are several tabs in developer console: Elements, Console, Sources, Network, Application, etc. Below we will consider each of them.
Elements
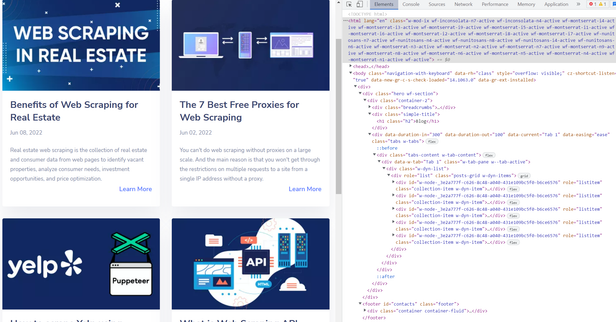
HTML code of the page is displayed there. It is important to note that this code is real-time updating. For example, if the SPA (Single Page Application) is opened, one will see all HTML elements, including those that were added dynamically via JavaScript.
Console
If there are calls to the console methods of the object in the site’s JavaScript code, the messages passed to those methods will be displayed on this tab.
For example:
console.log('Hello World!')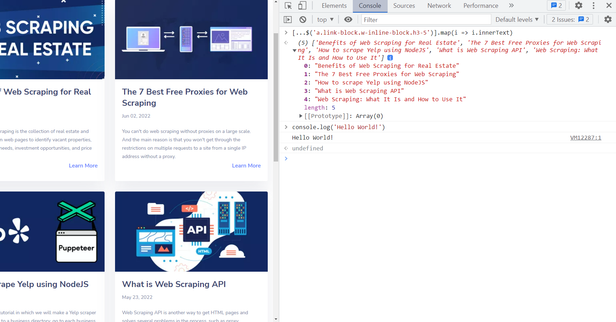
Console Tab
Sources
The Sources contain all JavaScript, CSS, Fonts, images and etc. that Chrome loaded during the process of displaying the web page.
The screenshot below shows the source code of one of the scripts downloaded by the browser during the opening of the google.com page.
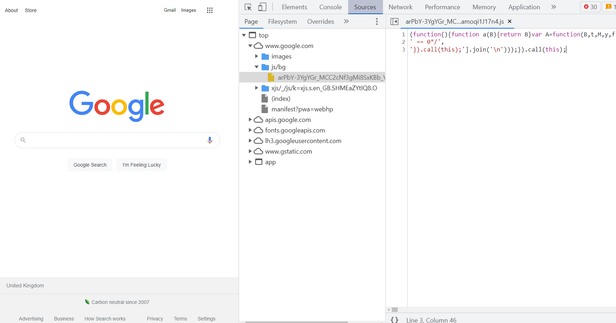
Sources Tab
Network
All requests that are made by the browser while DevTools is open are logged. It helps to collect records not only about the requests but also saves parameters which were used with these requests. For example, request & response headers, as well as response.
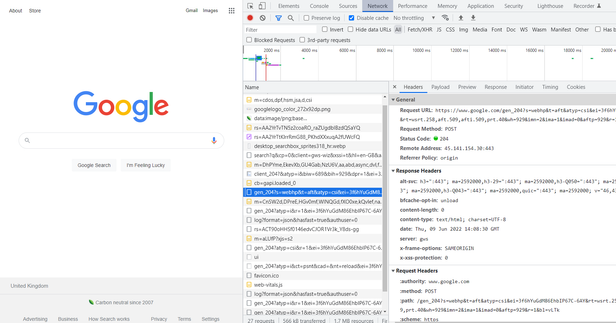
Network Tab
Application
In this section, one can see all data that a web page saved at Local Storage, Session Storage, IndexedDB, WebSQL, and Cookies in its work process.
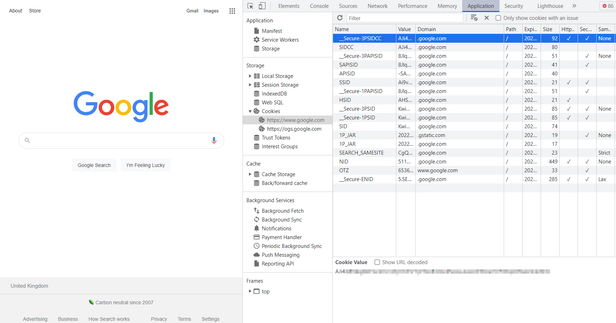
Application Tab
Other tabs
In the context of web scraping we will not consider them in detail, but here is a short description of each of them.:
- Performance. There one can measure the speed of web page loading by frames. The browser measures the stream of network resources, processor and RAM.
- Memory. Allows one to make a snapshot of the memory that the web page used while it’s working.
- Security. Contains information about the certificate of the domain on which the page runs and any other domains from which the resources were downloaded.
- Lighthouse. Allows you to create a report with Core Web Vitals metrics.
Tips & Tricks
1. Copy Element’s XPath or Selector
Go to the Elements panel, select the HTML element which selector you want to receive, right-click on it and select Copy from the menu that opens. From the drop-down menu, you can choose what you want to copy: CSS selector or XPath.
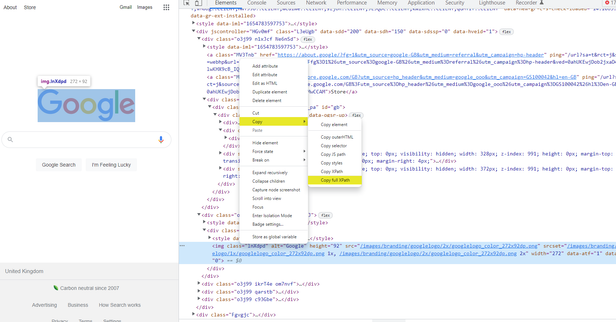
Copy Element’s XPath
2. Searching Element by Selector or XPath
Sometimes while scraper developing, one may need to make sure that the selector is correct and there are appropriate elements on the page. In this case, one can search for an element by selector on the Elements tab.
To do this one should enter the selector in the search bar. If there is one in the code, the console will find and highlight it.
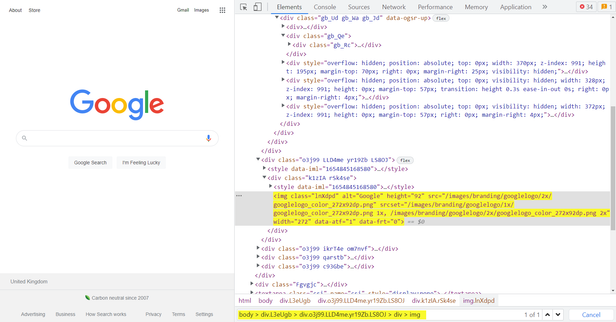
Searching Element by Selector or XPath
3. View the queries that the page makes during its work
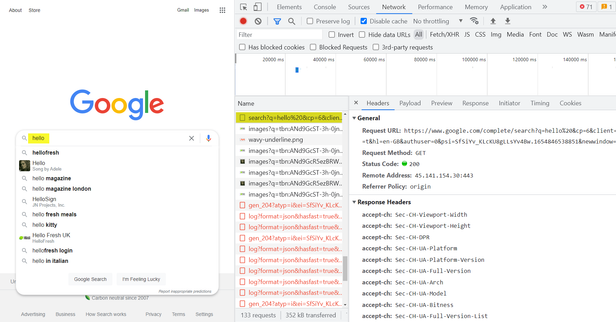
On the Headers tab, you can find the URL and HTTP request method, as well as the Response & Request Headers.
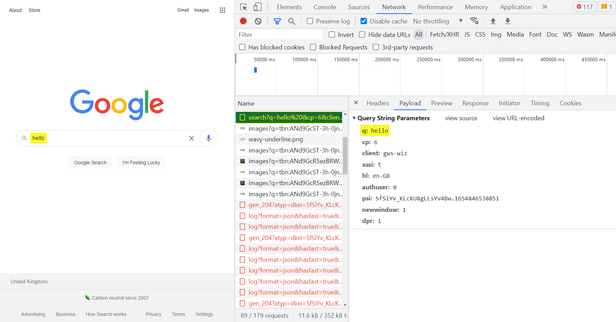
The Payload tab displays the parameters which the query was made with. This example sends a query with the parameter q=hello to obtain search suggestions.
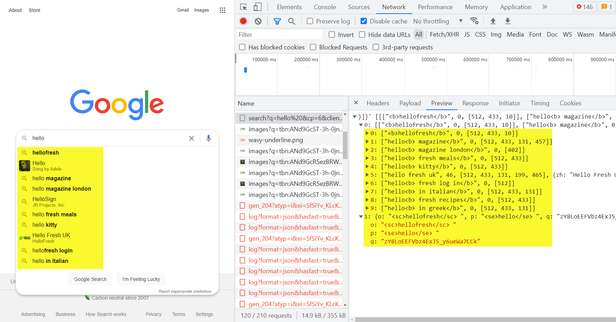
The Preview tab shows the response from the server.
4. Keep requests while page updating
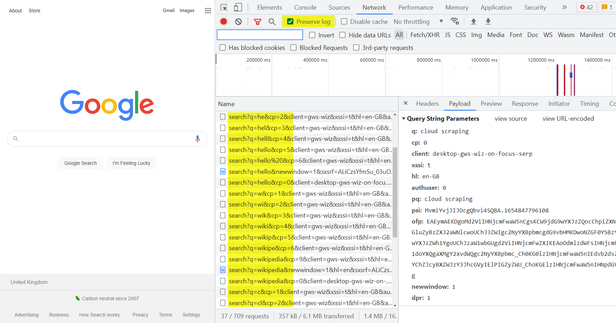
To prevent requests from being cleared after the page is reloaded, click the checkbox Preserve log.
5. Convert a query from Network to code
In the list of requests right-click on the query, then in the context menu click Copy, and in the submenu click on the desired option.
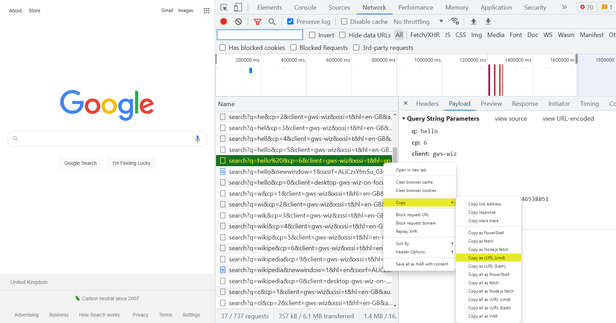
Convert a query from Network to code
Conclusion and Takeaways
So we can say that the built-in developer console is a very simple and convenient tool for scraping web pages and developing frontend or backend applications.
It allows one to check the correctness of picked selectors and copy the CSS selector or XPath instead of composing it oneself.

